Web UI Design
Contents
Web UI Design#
This technical note provides UI and interaction design specifications for a first implementation of the GFINDER Web Viewer. The function/goal of this first web viewer is to visualise output opportunity data files: sequence and observations GeoEvt files.
UI specifications#
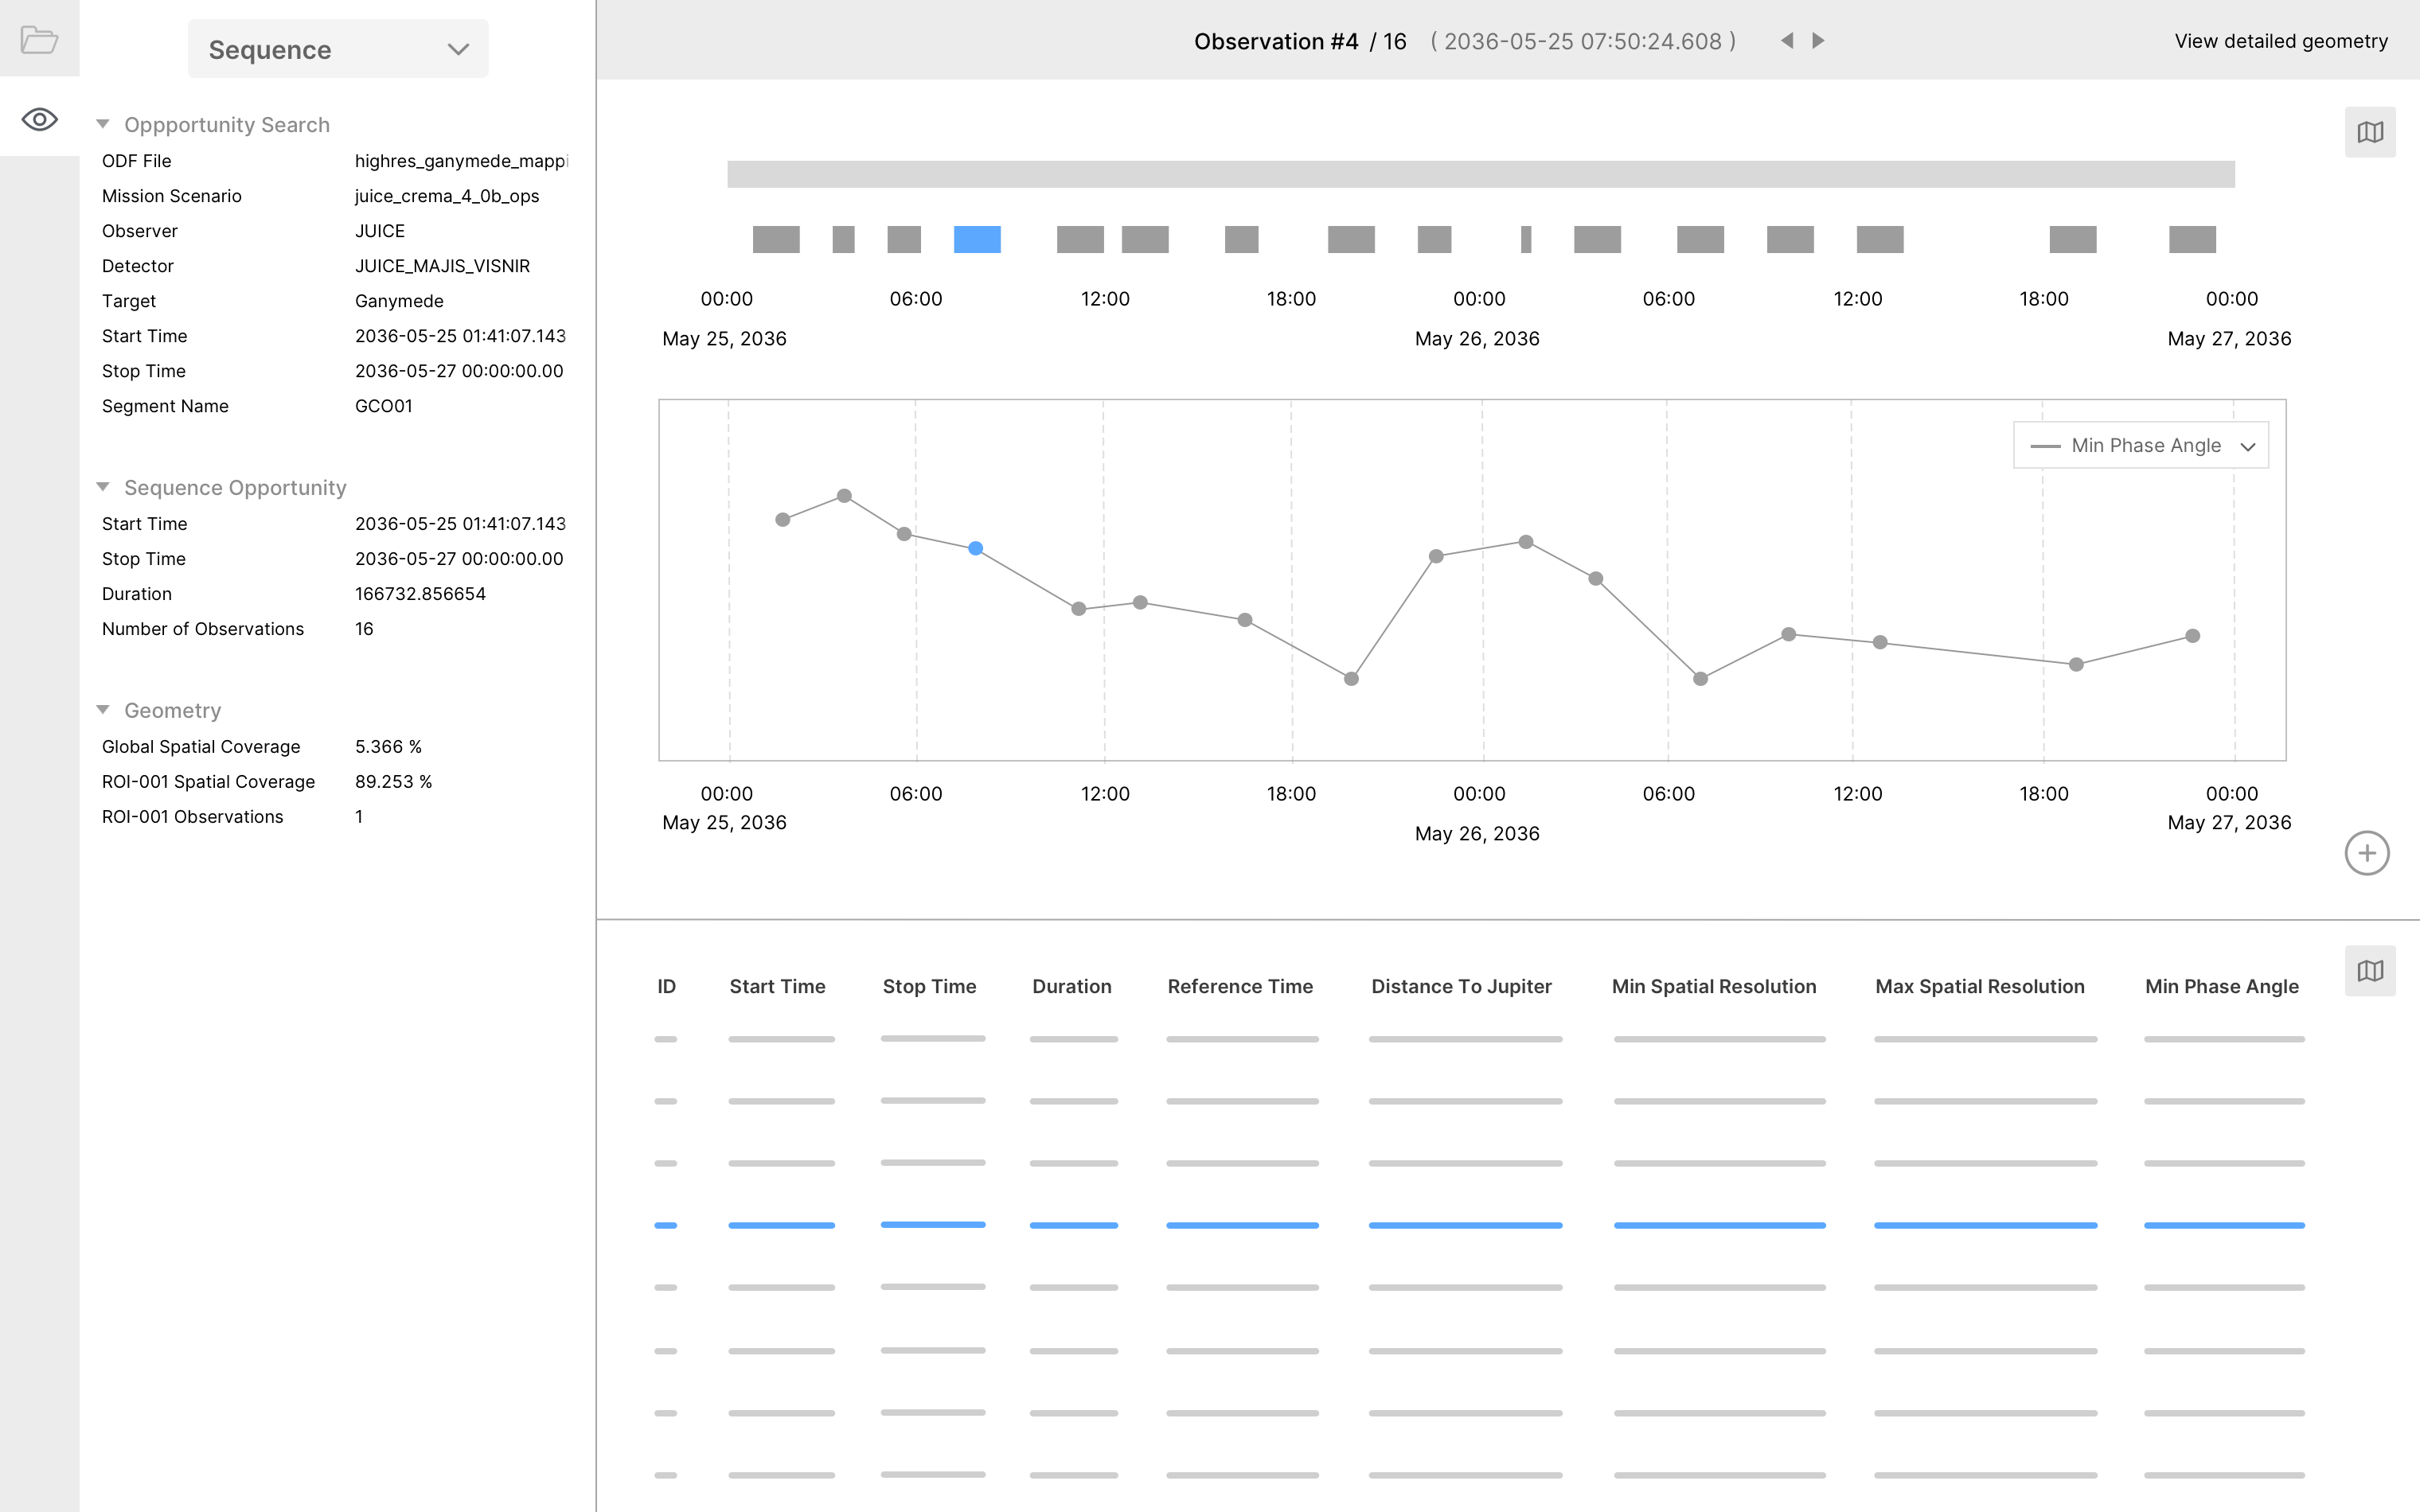
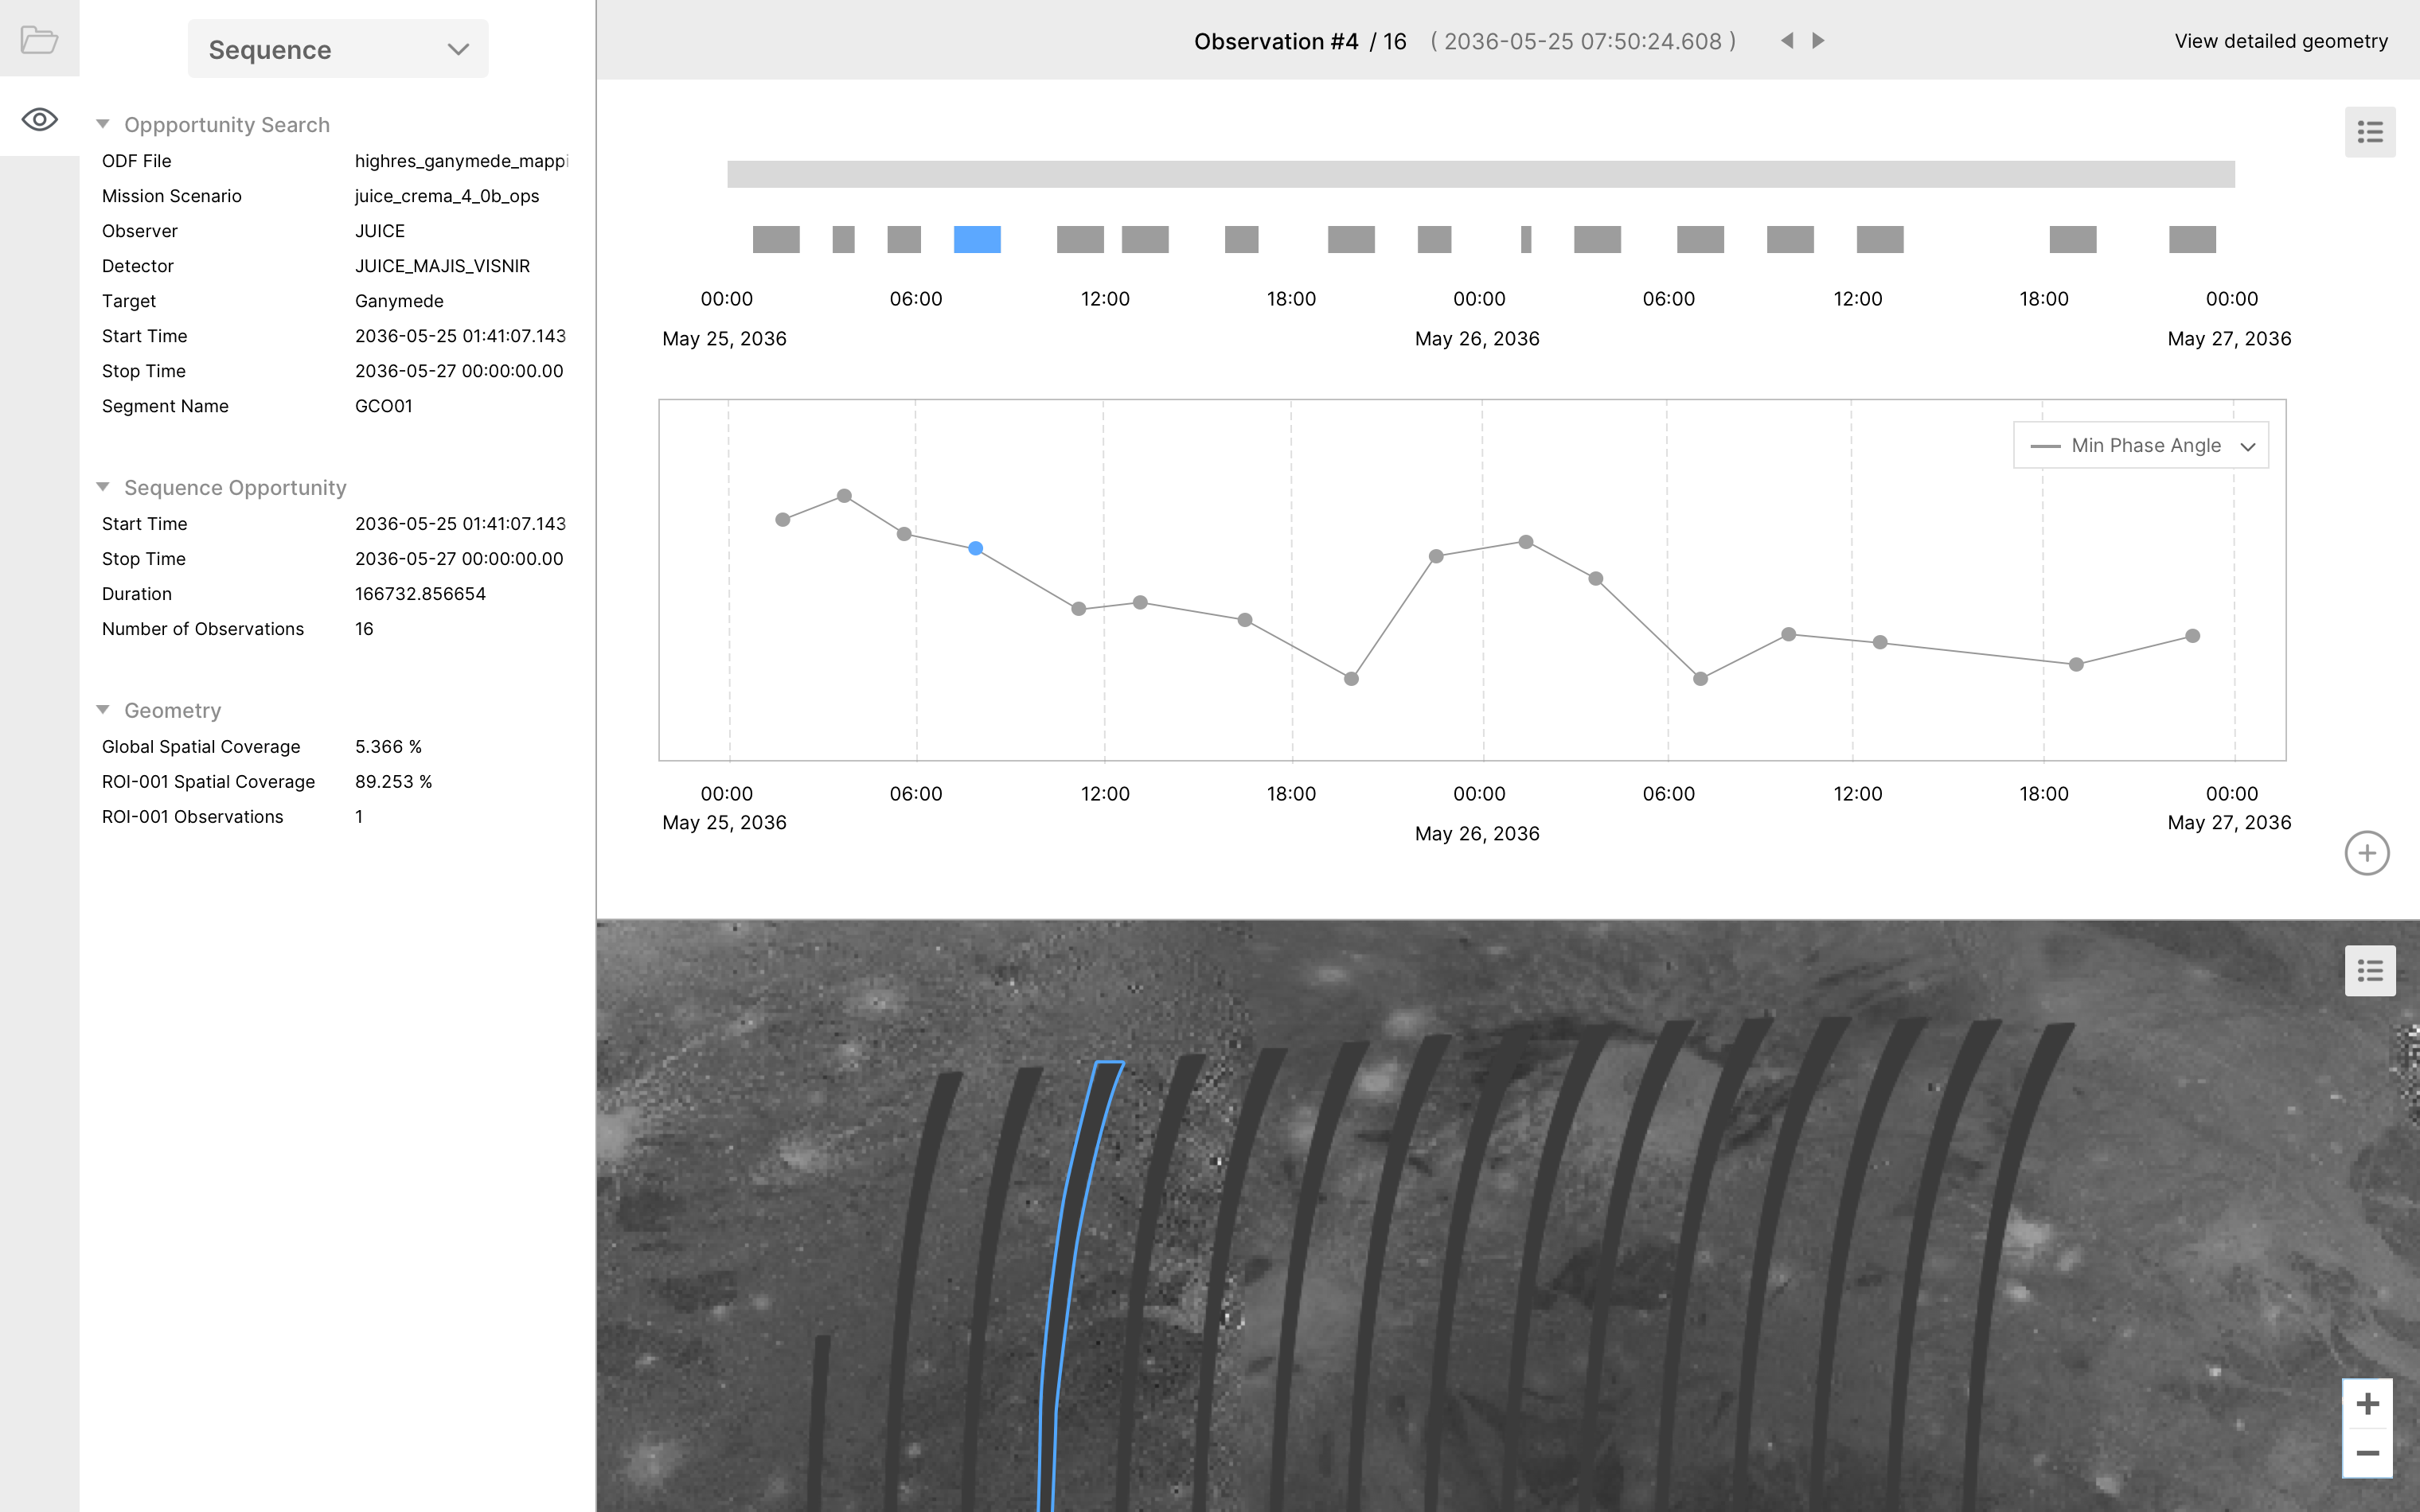
The UI consists of the following components/functionalities:
App Menu
It is placeholder for future top-level GFINDER web app navigation.
Currently: (1) Open GeoEvt file, and (2) Visualise GeoEvt data.
Geometry Event Panel
GeoEvt Selector (sequence or observation)
Dropdown button indicates currently selected sequence or observation.
Dropdown (when clicked) lists sequence and its observations.
When an observation is selected, all panels/data views are refreshed, and left/right arrows appears to facilitate navigation from one observation to another.
Properties (of the selected sequence or observation)
GeoEvt filename
Related Opportunity Search
Opportunity Definition
Mission Scenario
Search Window
Timing information (search result)
Start / Stop Time / Duration
Number of observation opportunities
Number of observation measurements
Geometry data
Sub-events Viewer Panel
Sub-events Navbar
Display user-selected sub-event (observation or measurement) ID, reference time, and total number of subsets
Buttons to go to previous/next sub-event, controlling the selection of sub-event visual representation in Data Viewer panels (eg: dot, time window, swath)
Sequence-level navbar include a link to view detailed geometry of selected observation
Data Viewer Panel 1
Contains one of the available Data Views (time series, table, or map).
Data View Switcher
Resize panel or toggle full screen
Data Viewer Panel 2
Contains one of the available Data Views (time series, table, or map).
Data View Switcher
Resize panel or toggle full screen
Data Views
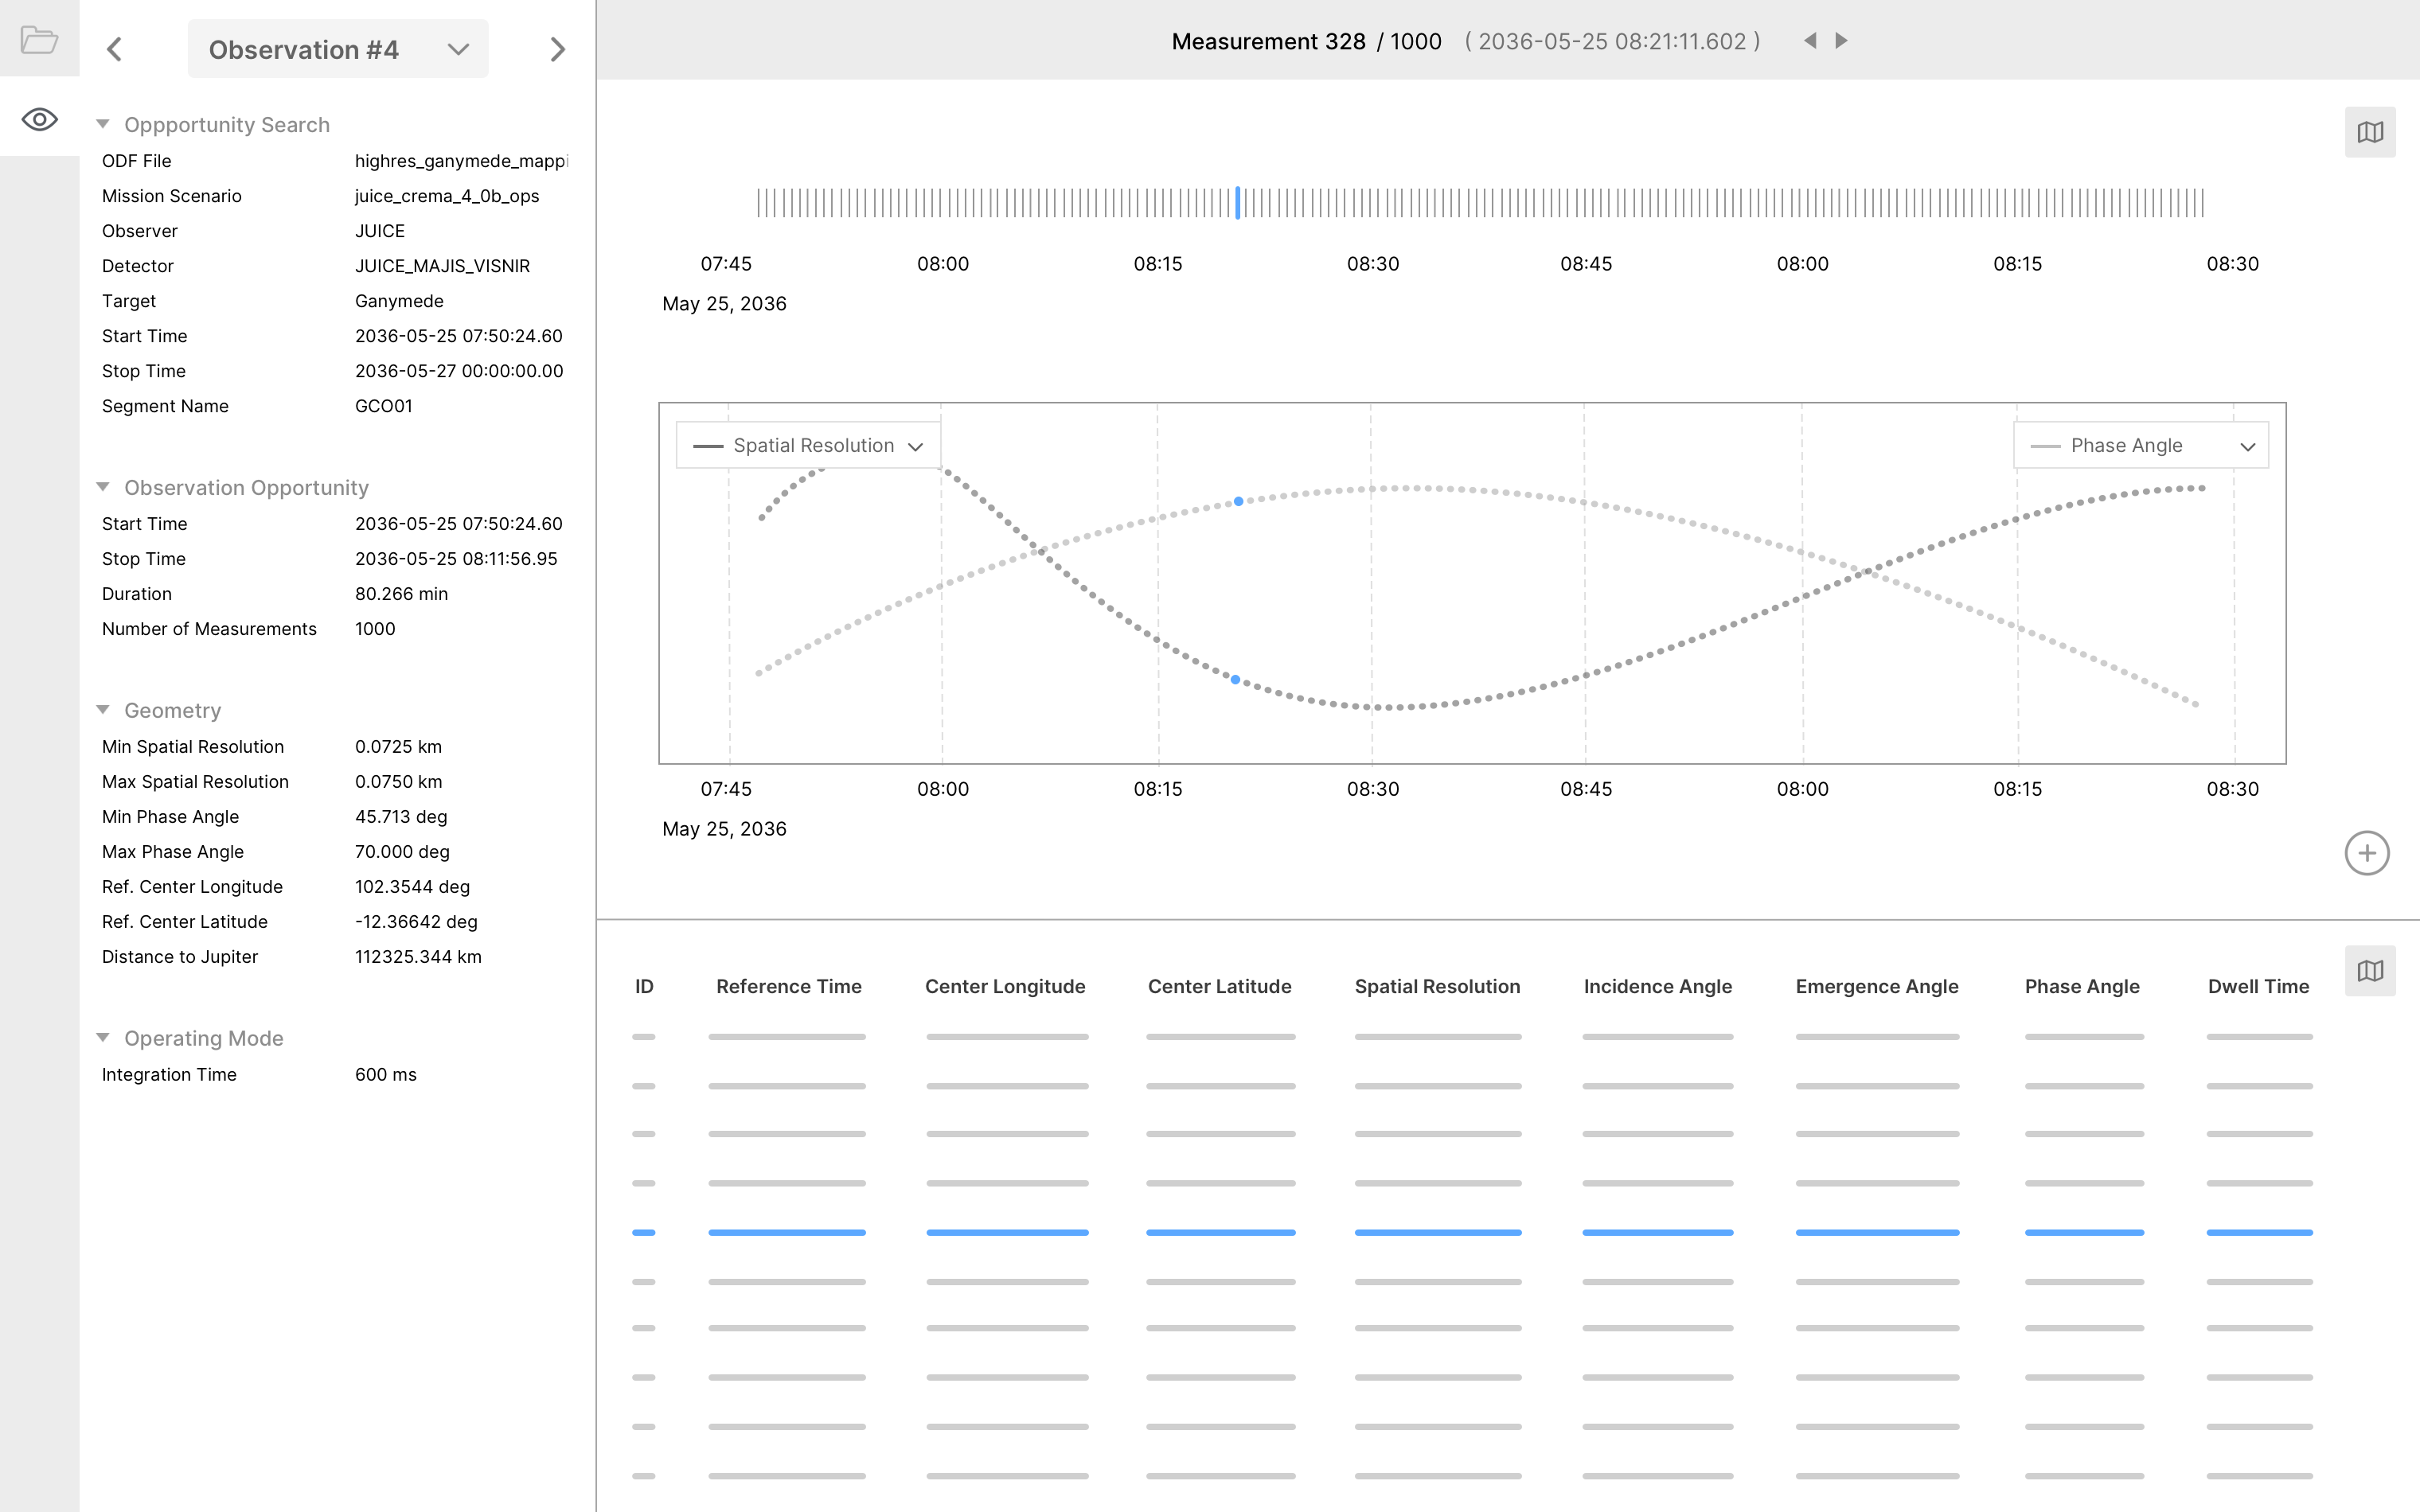
Time Series View
By default, contains a sub-events timeline chart
User can add one of several (time series) chart
User can add sub-event scalar properties to a given chart
Left vertical axis (same units)
Right vertical axis (same units)
Click sub-event visual element (dot) selects this sub-event
Table View
Display all sub-events properties
Click sub-event visual element (row) selects this sub-event
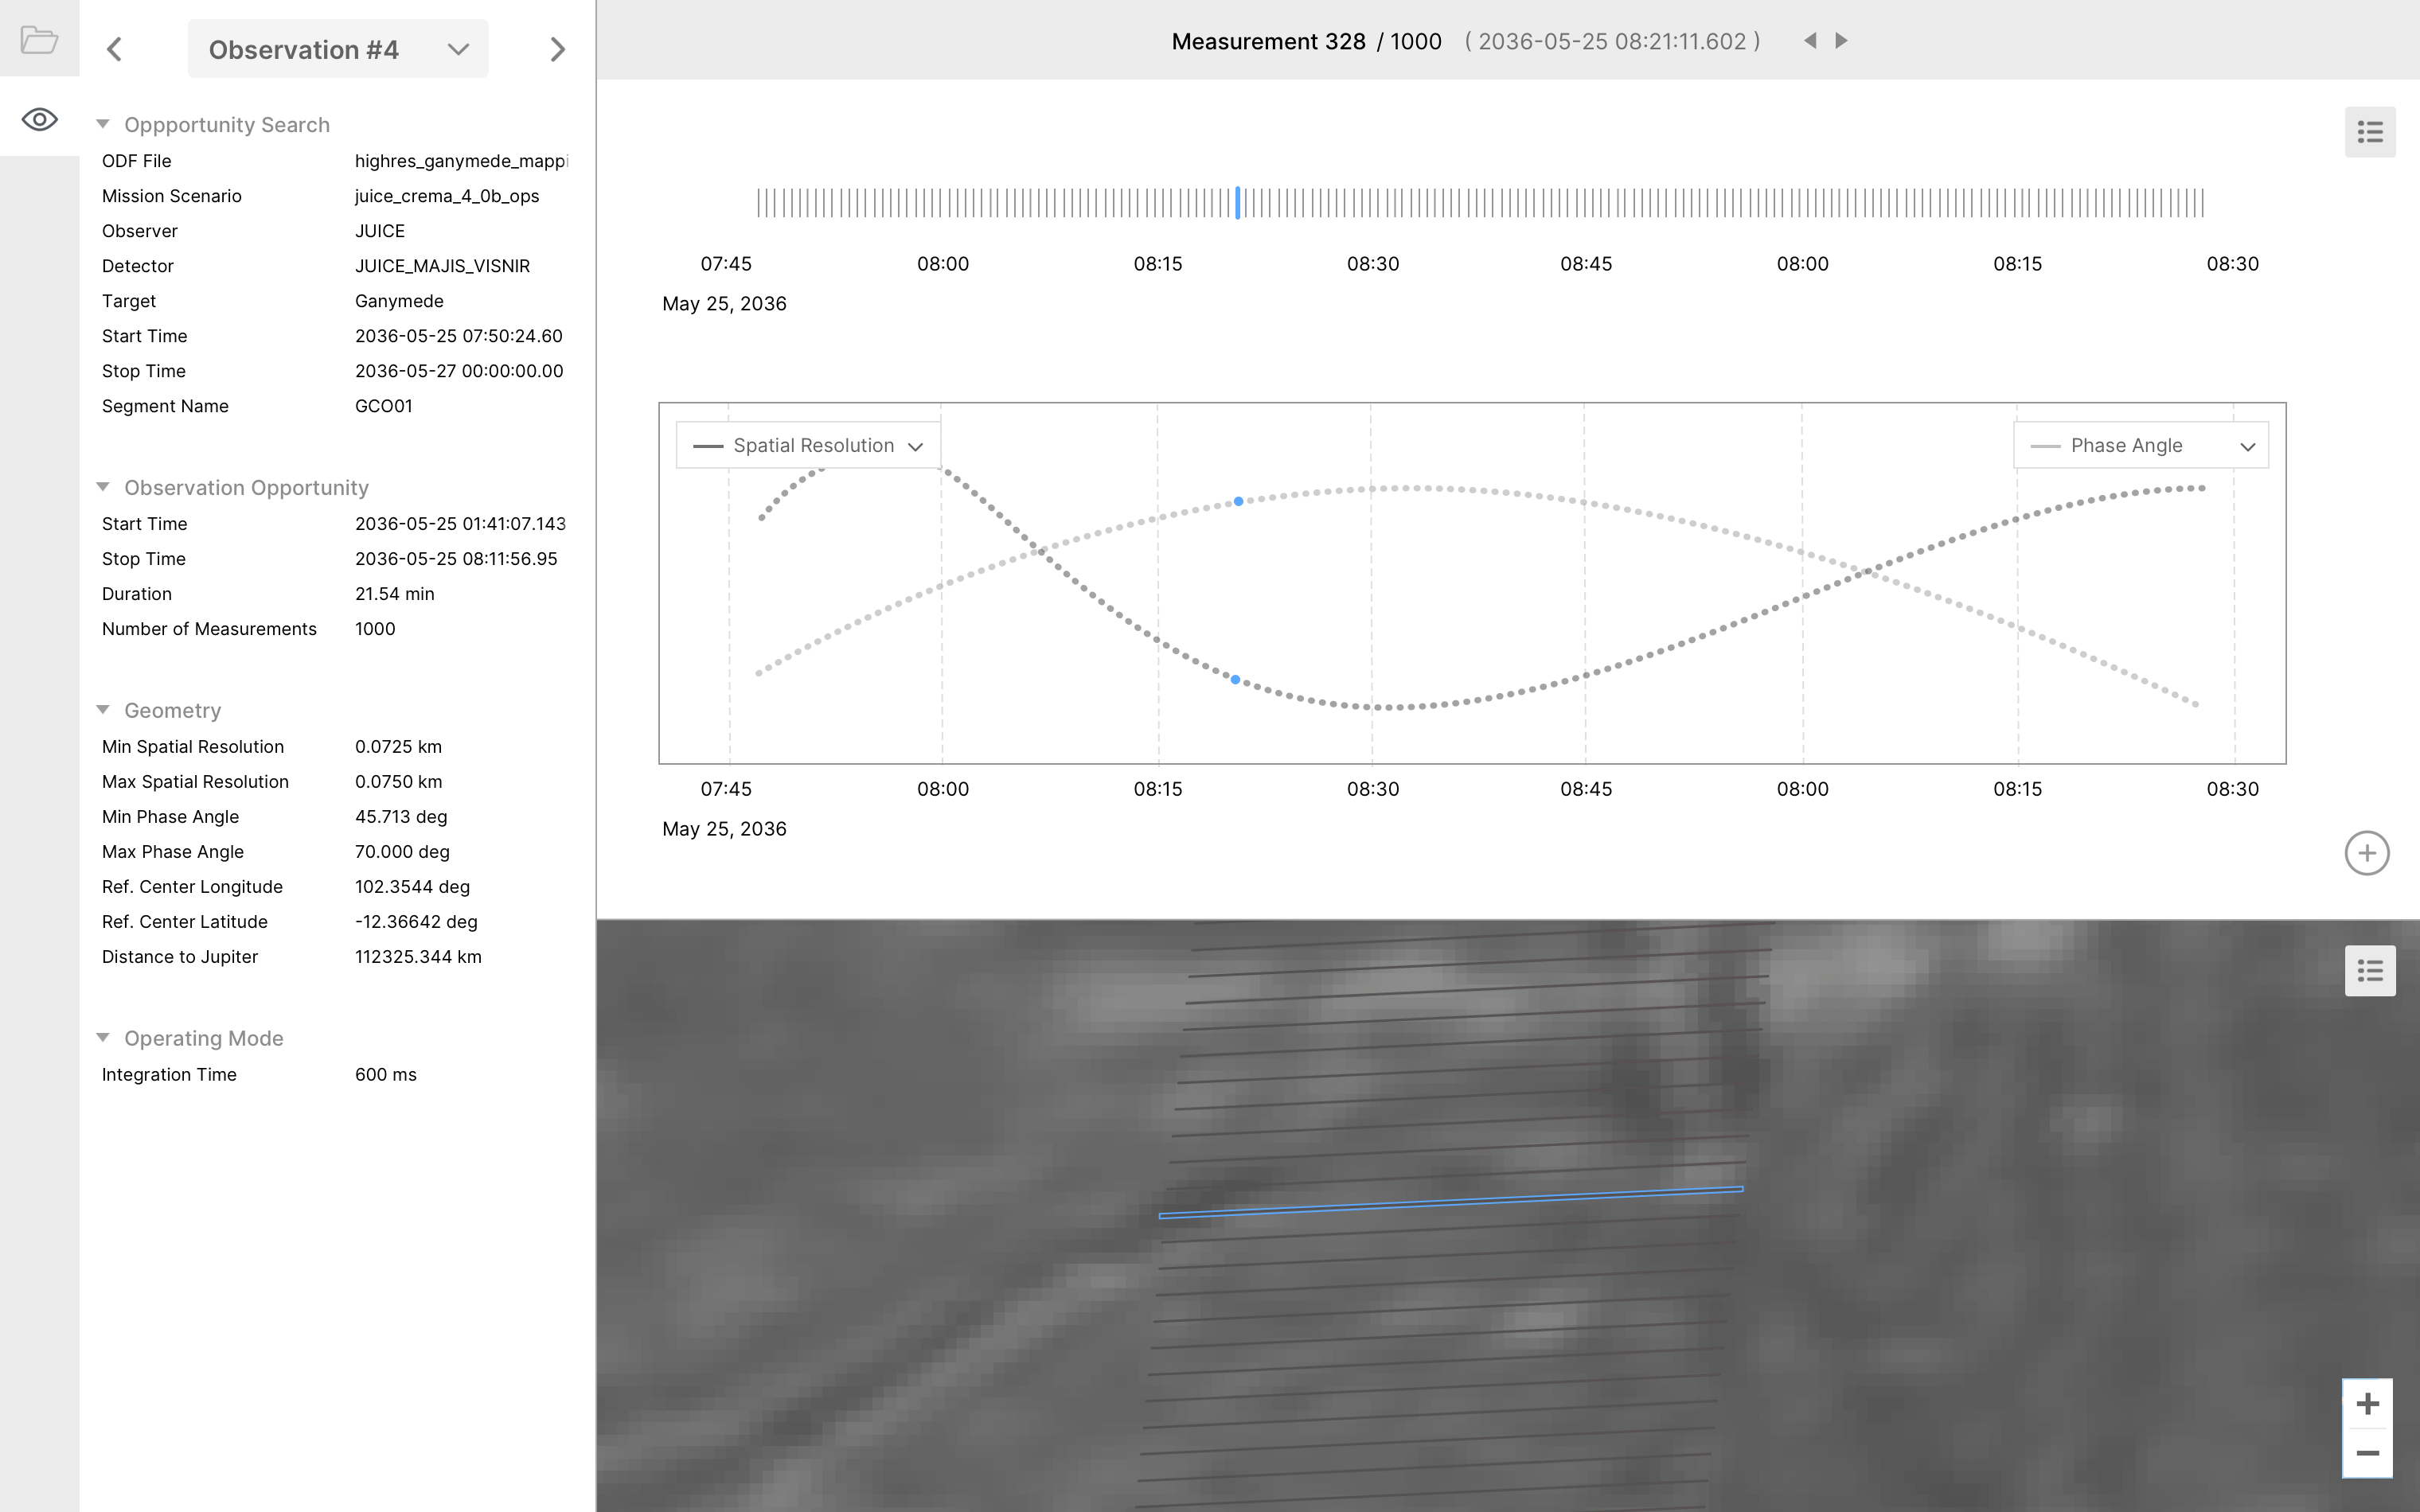
Map View
Display footprint of sub-events (observations or measurements)
Footprints can be color-coded based on a given properties
Click sub-event visual element (footprint) selects this sub-event
Mockups#
Sequence View, providing an overview of observation opportunities (timing + geometry):
Observation View, providing a detailed view of each observation opportunity (timing + geometry):
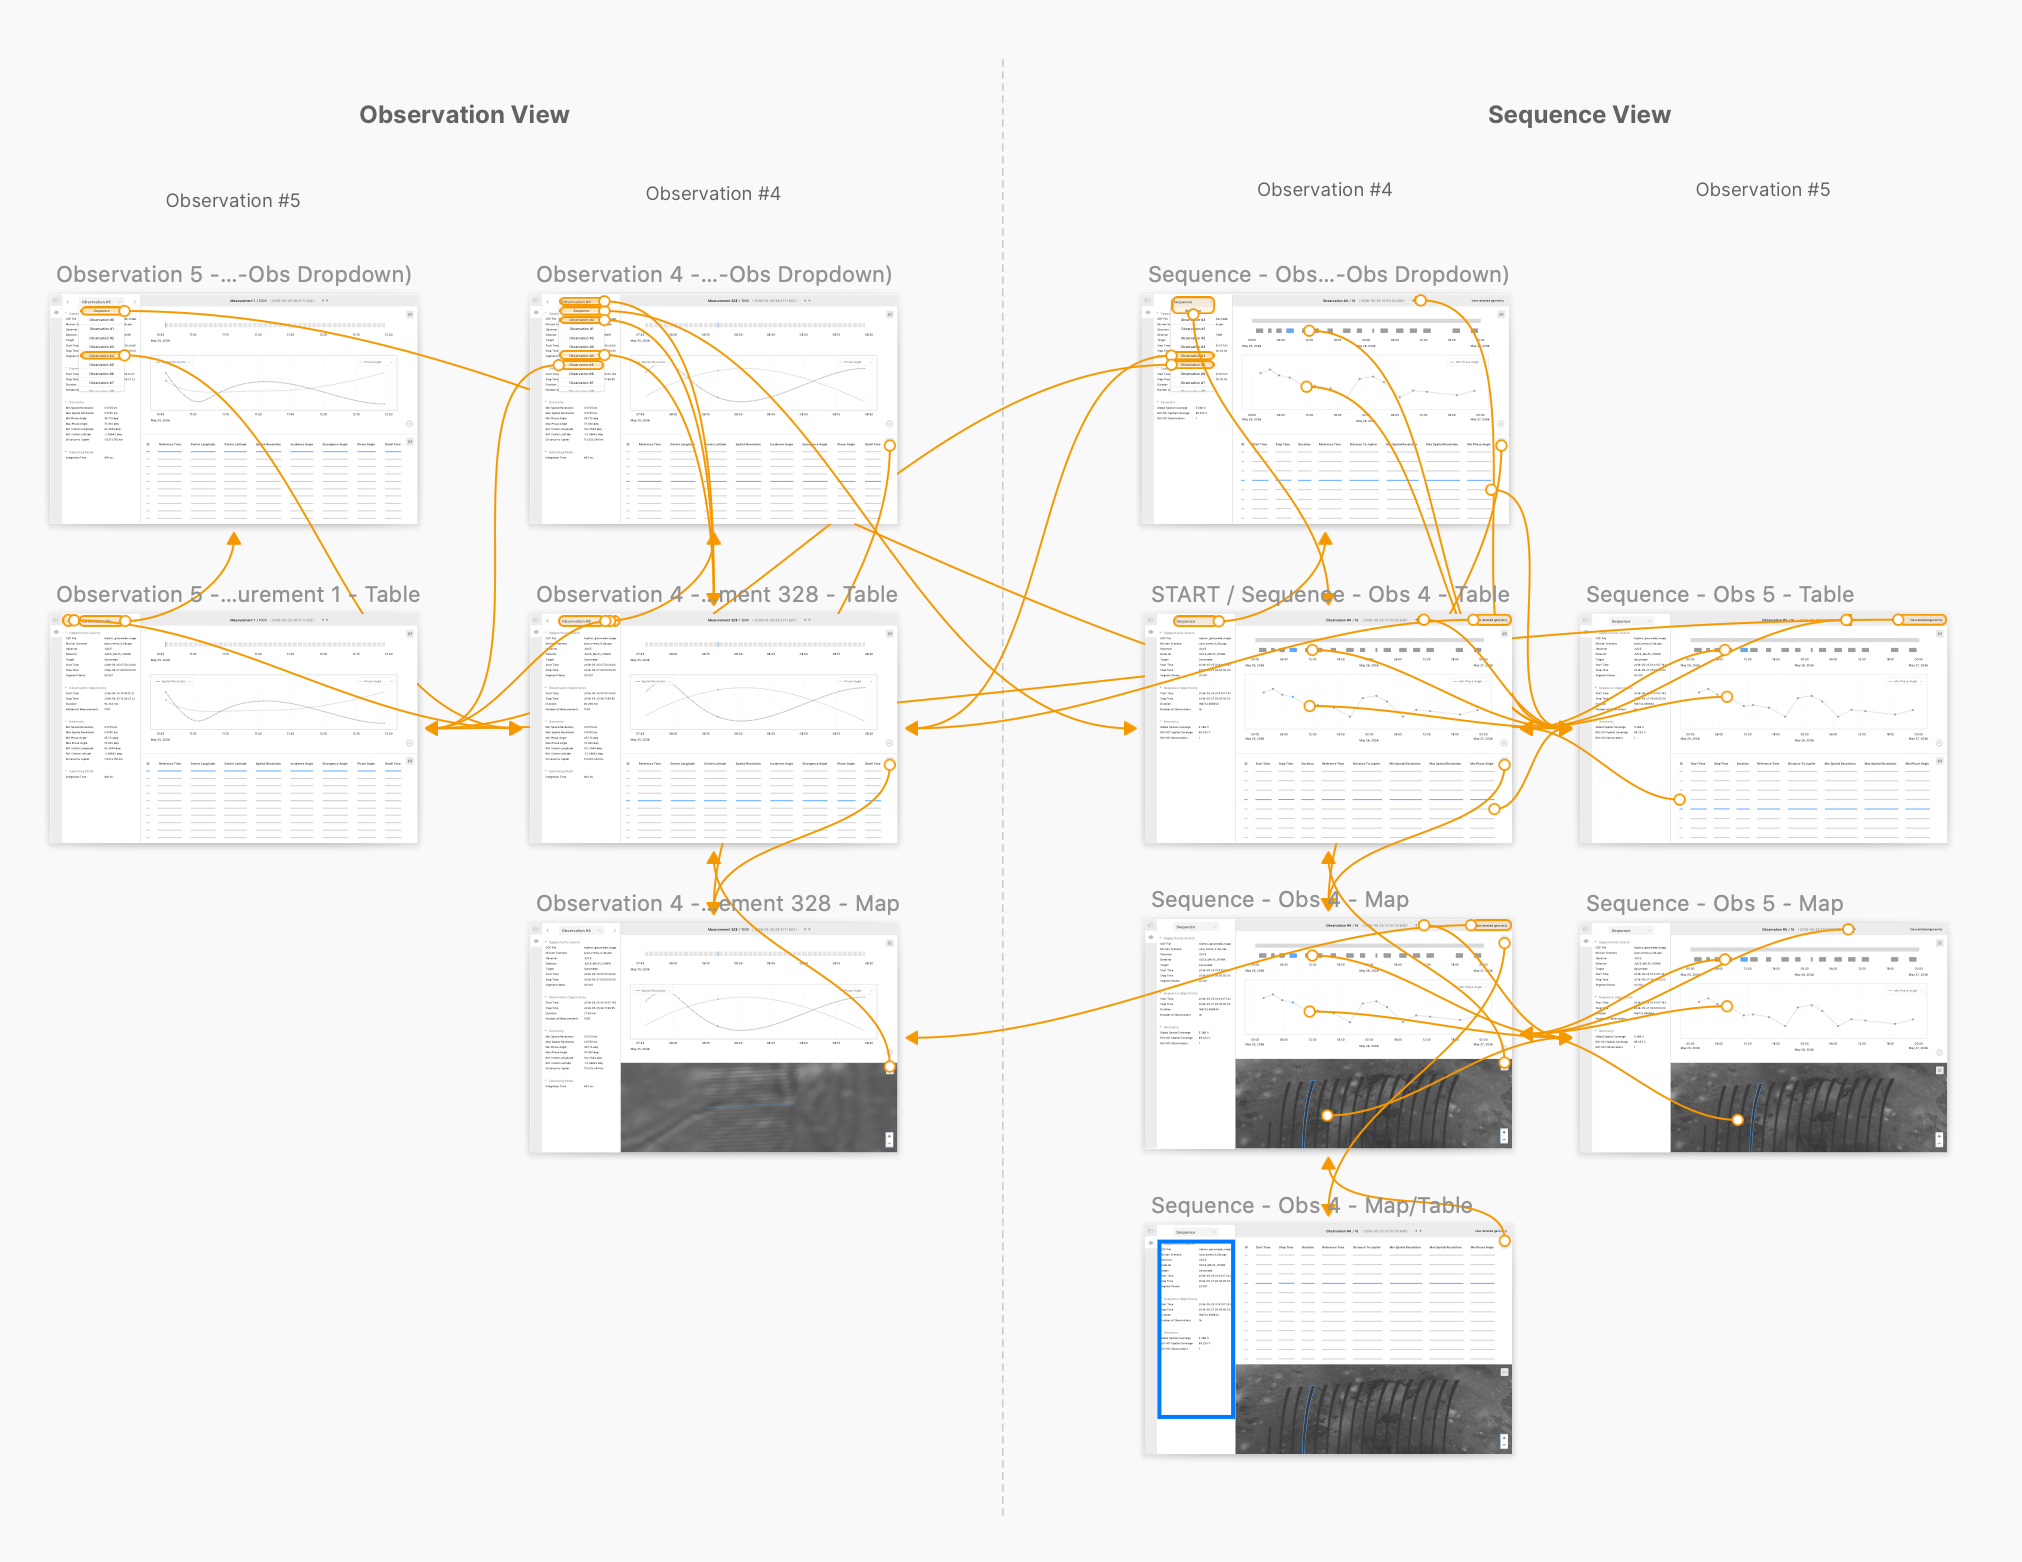
Clickable prototype#
General layout
Sequence View (observations navigation)
Observation View (measurements navigation)
